
Devtools
The devtools panel is a dedicated window for inspecting gadget behavior at runtime. It shows log output, timing spans, and structured metadata from all active gadgets in a single stream. Use it to verify that your gadget initializes correctly, produces the right search results, and performs within acceptable response times.
Opening the panel
Section titled “Opening the panel”There are two ways to open the devtools:
- System tray: right-click the Torchsnap tray icon and select “Developer Tools…”.
- Launcher search: type “devtools” (or “debug”, “console”, “logs”) into the search bar and activate the “Developer Tools” entry.
There is currently no keyboard shortcut for opening the panel.
Console
Section titled “Console”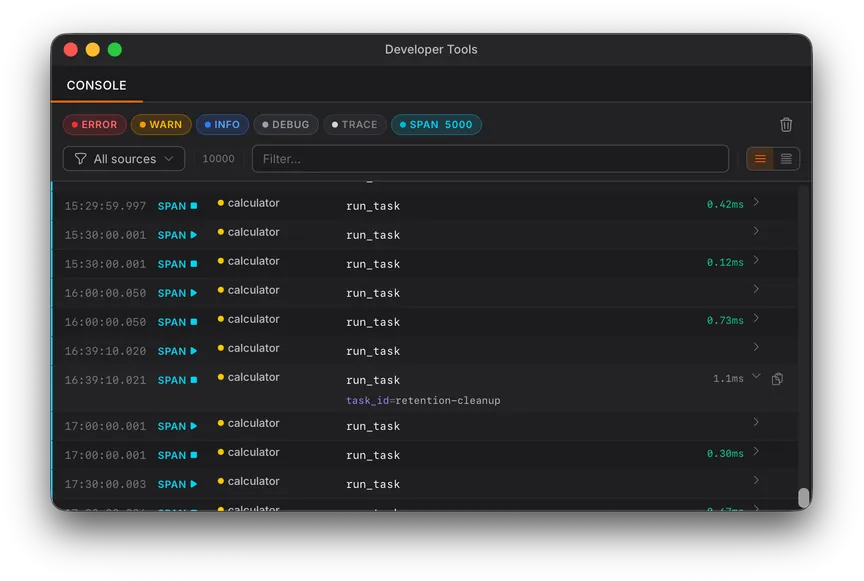
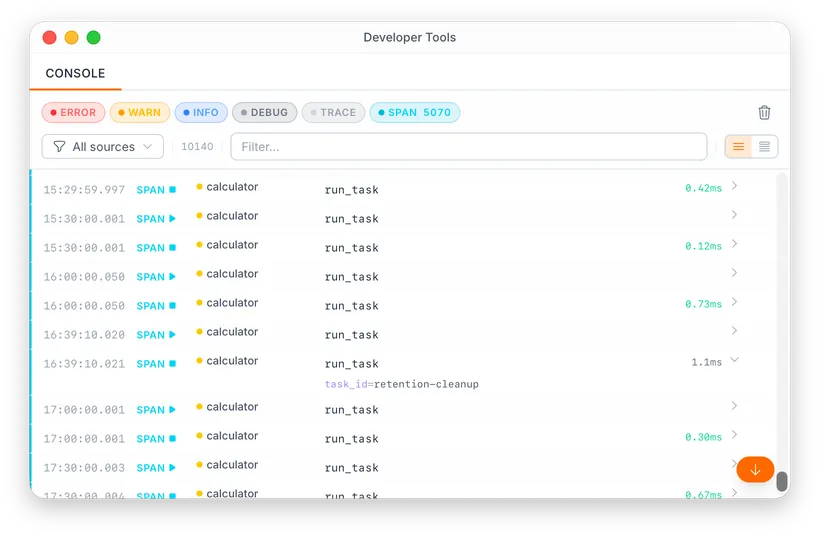
The console is the main view of the devtools panel. It streams every log entry from all active gadgets and the host in real time. Each entry shows:
- Timestamp at millisecond precision.
- Level badge: TRACE, DEBUG, INFO, WARN, or ERROR, color-coded by severity.
- Source: the gadget ID (with a colored dot per gadget) or “host” for host-internal messages.
- Message: the log text.
- Metadata: entries with key-value pairs can be expanded inline to show the structured data. Click any row to expand.
A copy button appears on hover to copy the full entry as formatted text.
Filtering
Section titled “Filtering”The toolbar provides several ways to narrow down the log stream:
- Level filters: toggle individual levels (Error, Warn, Info, Debug, Trace) on or off. Only matching entries are shown.
- Span filter: toggle visibility of timing span entries separately.
- Source dropdown: filter by gadget or show only host messages. Each gadget is listed with its colored dot for quick identification.
- Text search: filter entries by message content. Focused with
Cmd+F. - Clear: discard all entries in the view (
Cmd+K).
The entry count in the toolbar shows how many entries match the current filters out of the total.
All filtering happens client-side. The backend always captures and streams the full log output regardless of what filters are active.
Timing spans
Section titled “Timing spans”Calls to logging::span_start and
logging::span_end appear in the
console alongside regular log messages. Span entries are marked with start
and end badges and show:
- The span name.
- A duration badge for completed spans, color-coded by elapsed time (green for fast, amber for moderate, red for slow).
- A “running” indicator for spans that have started but not yet ended.
Flat view vs tree view
Section titled “Flat view vs tree view”The console supports two display modes, toggled from the toolbar:
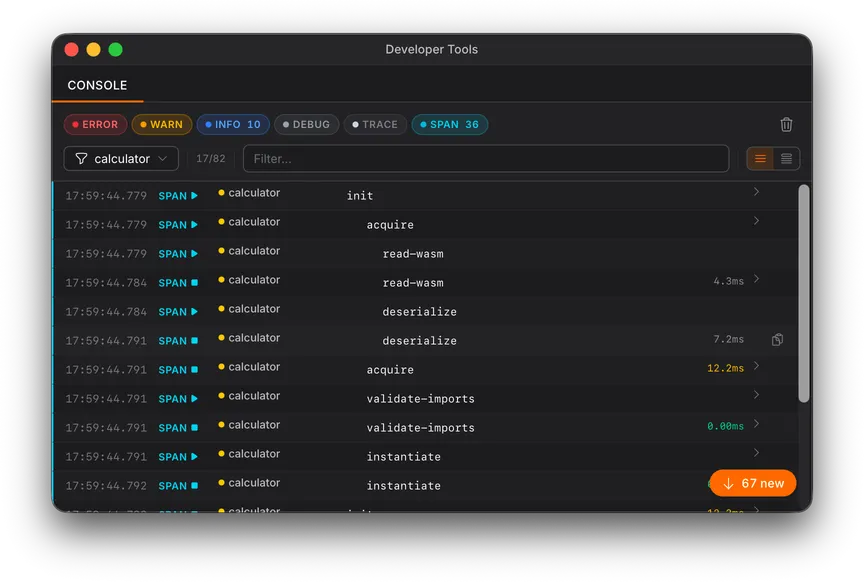
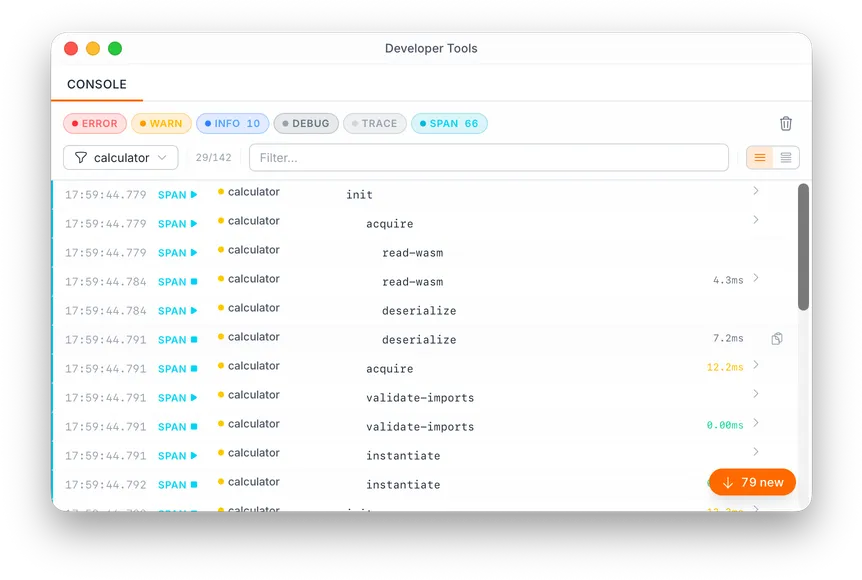
Flat view shows every entry in chronological order, one after another, regardless of span nesting. This is useful for seeing the exact sequence of events as they happened across all gadgets.
Tree view groups log messages under the span that was active when they were
emitted. Spans appear as collapsible nodes with their child messages nested
underneath. Nested spans (created with a parent handle) form a hierarchy. This
makes it easy to see which log messages belong to a specific operation, like
tracing all the steps inside a gadget’s enable() call or a single search
cycle. Spans without a parent appear at the root level.
Tips for gadget debugging
Section titled “Tips for gadget debugging”Use the SDK logging macros (log_info!, log_debug!, etc.) liberally during
development. Structured metadata is particularly useful for inspecting values
without adding temporary debug output:
log_info!("Search completed", "query" => &query, "results" => results.len(), "elapsed_ms" => elapsed.as_millis(),);Wrap expensive operations in timing spans to identify performance bottlenecks:
let span = logging::span_start("api-fetch", None, &[]);let response = http::fetch(&request)?;logging::span_end(span, &[("status".into(), response.status.to_string())]);